Financial Statements Analysis: 6 Secrets to Win the Market
Are you investing in stocks without understanding financial statements? 📊📉
Do you feel overwhelmed when looking at company reports and don’t know what numbers actually matter?
You’re not alone.
Thousands of Indian investors lose money every year—not because the market is bad, but because they can’t read the financial health signals companies are clearly showing!
But what if you could analyze any company’s financial statements with confidence in just 15 minutes?
✅ No accounting degree needed.
✅ No complex formulas.
✅ Just practical knowledge that separates successful investors from the crowd.
In this beginner-friendly guide, I’ll show you exactly how to do:
financial statements analysis
Identify financially strong companies
Spot accounting red flags before investing
Use free tools to analyze any Indian stock
Let’s turn confusion into clarity. Ready to become a smarter investor? 🚀
👉 Let’s begin!
Topics Covered
1. What Are Financial Statements?
Financial statements are official reports that show a company's financial health — how much it owns, how much it owes, how much it earns, and how much cash it generates.
The 3 Most Important Financial Statements:
| Statement | Purpose | Key Takeaways |
|---|---|---|
| 🧾 Balance Sheet | Shows assets, liabilities & equity | What the company owns vs. owes |
| 💹 Profit & Loss | Shows income, expenses & net profit | Is the company profitable or not? |
| 💵 Cash Flow | Shows cash inflows & outflows | Where cash is coming from & going |
Think of these statements as a complete health checkup for the company:
- Balance Sheet = Overall physical condition
- P&L Statement = Weight and nutrition report
- Cash Flow = Heart and blood circulation health
✅ You need all three to make smart investment decisions!
2. The Balance Sheet Explained
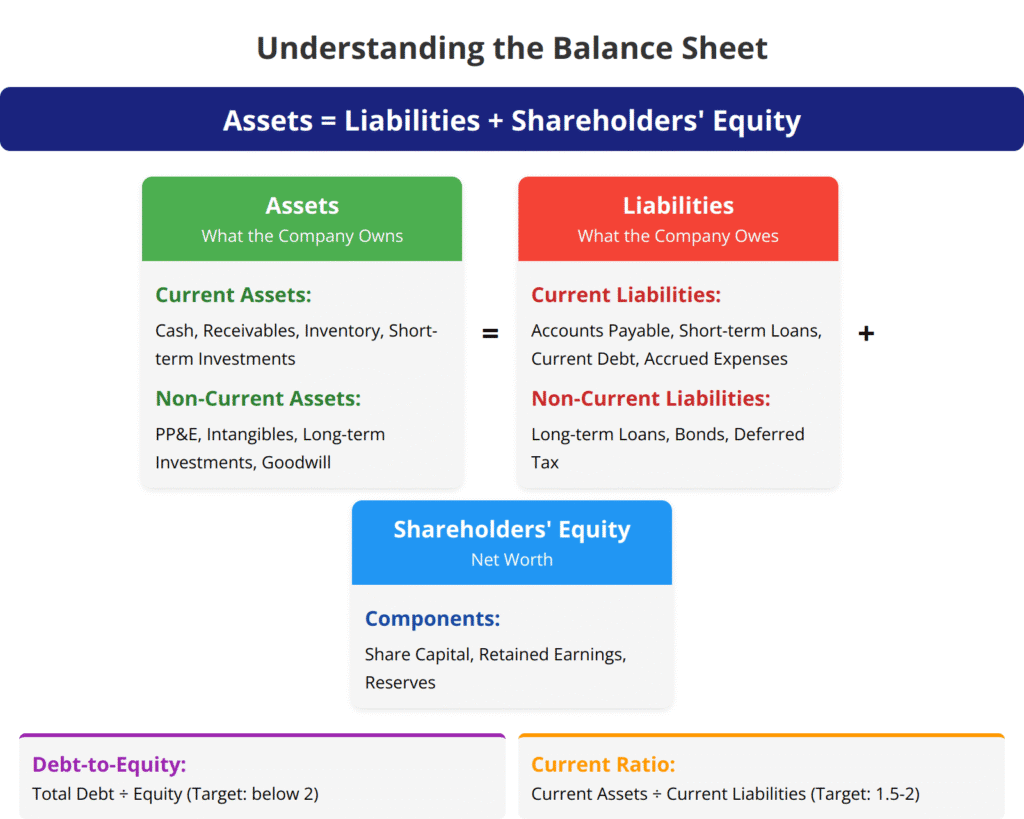
A balance sheet reveals a company’s financial position at a specific moment in time, like a photograph of its financial health.
The Fundamental Equation:
Assets = Liabilities + Shareholders’ Equity
If this equation doesn’t balance, something is wrong with the accounting.
Key Components:
Assets (What the Company Owns)
- Current Assets: Can be converted to cash within a year
- Cash and Cash Equivalents
- Short-term Investments
- Accounts Receivable (money owed by customers)
- Inventory
- Non-Current Assets: Long-term investments
- Property, Plant & Equipment (PP&E)
- Intangible Assets (patents, trademarks)
- Long-term Investments
- Goodwill
Liabilities (What the Company Owes)
- Current Liabilities: Must be paid within a year
- Accounts Payable (money owed to suppliers)
- Short-term Loans
- Current Portion of Long-term Debt
- Accrued Expenses
- Non-Current Liabilities: Long-term obligations
- Long-term Loans
- Bonds Payable
- Deferred Tax Liabilities
Shareholders’ Equity (Net Worth)
- Share Capital
- Retained Earnings
- Reserves
Example: Tata Motors Balance Sheet Snapshot (Simplified)
Assets: ₹1,50,000 Crore
 - Current Assets: ₹60,000 Crore
 - Non-Current Assets: ₹90,000 Crore

Liabilities: ₹90,000 Crore
 - Current Liabilities: ₹40,000 Crore
 - Non-Current Liabilities: ₹50,000 Crore

Shareholders' Equity: ₹60,000 Crore
Key Ratios to Calculate:
- Debt-to-Equity Ratio = Total Debt ÷ Shareholders’ Equity
- For Tata Motors: ₹90,000 Cr ÷ ₹60,000 Cr = 1.5
- Lower is better, industry-dependent (below 2 is generally acceptable)
- Current Ratio = Current Assets ÷ Current Liabilities
- For Tata Motors: ₹60,000 Cr ÷ ₹40,000 Cr = 1.5
- Should be above 1, ideally 1.5-2
Red Flags to Watch For:
- Consistently increasing debt levels
- Current ratio below 1 (may indicate liquidity problems)
- Negative shareholders’ equity
- Unexplained changes in major asset categories
3. The Profit & Loss Statement Decoded
The P&L statement (Income Statement) shows a company’s revenues, costs, and profitability over a specific period.
Key Components:
Revenue
- Net Sales/Revenue: Money earned from primary business activities
- Other Income: Interest, dividend, or one-time gains
Expenses
- Cost of Goods Sold (COGS): Direct costs of producing goods/services
- Operating Expenses:
- Selling, General & Administrative (SG&A)
- Research & Development (R&D)
- Depreciation & Amortization
- Finance Costs: Interest payments on debt
- Tax Expenses
Profit Metrics
- Gross Profit = Revenue – COGS
- Operating Profit (EBIT) = Gross Profit – Operating Expenses
- Profit Before Tax (PBT) = EBIT – Finance Costs + Other Income
- Net Profit (PAT) = PBT – Tax Expenses
- Earnings Per Share (EPS) = Net Profit ÷ Number of Outstanding Shares
Example: Infosys P&L Statement FY24 (Simplified)
Revenue: ₹1,46,000 Crore
COGS & Operating Expenses: ₹1,01,000 Crore
Operating Profit: ₹45,000 Crore
Other Income & Finance Costs (Net): ₹3,000 Crore
Profit Before Tax: ₹48,000 Crore
Tax Expenses: ₹26,000 Crore
Net Profit: ₹22,000 Crore
EPS: ₹52 per share
Key Ratios to Calculate:
- Gross Profit Margin = (Revenue – COGS) ÷ Revenue × 100%
- Higher is better, should be stable or improving
- Operating Profit Margin = Operating Profit ÷ Revenue × 100%
- For Infosys: ₹45,000 Cr ÷ ₹1,46,000 Cr × 100% = 30.8%
- Shows efficiency in core operations
- Net Profit Margin = Net Profit ÷ Revenue × 100%
- For Infosys: ₹22,000 Cr ÷ ₹1,46,000 Cr × 100% = 15.1%
- Overall profitability including taxes and interest
Red Flags to Watch For:
- Declining revenue growth
- Falling profit margins
- Expenses growing faster than revenue
- Inconsistent or volatile earnings
- One-time gains artificially boosting profits
📖 Investing vs Trading: Which One is Best for You?
4. The Cash Flow Statement Simplified
The Cash Flow Statement tracks the actual movement of cash in and out of the business. A company can be profitable on paper but still face cash shortages.
Three Sections of Cash Flow:
1. Operating Activities (CFO)
- Cash generated from core business operations
- Key sources: Customer payments, interest/dividends received
- Key uses: Payments to suppliers, employees, taxes
2. Investing Activities (CFI)
- Cash used for long-term assets and investments
- Key sources: Sale of property/equipment, divestments
- Key uses: Purchase of property/equipment, acquisitions
3. Financing Activities (CFF)
- Cash related to funding the business
- Key sources: Loans taken, equity issuance
- Key uses: Loan repayments, dividend payments, share buybacks
Example: Infosys Cash Flow Statement FY24 (Simplified)
Net Cash from Operating Activities: ₹27,000 Crore
Net Cash used in Investing Activities: ₹(6,000) Crore
Net Cash used in Financing Activities: ₹(18,000) Crore
Net Increase/(Decrease) in Cash: ₹3,000 Crore
Key Metrics to Calculate:
- Free Cash Flow (FCF) = Operating Cash Flow – Capital Expenditures
- For Infosys: ₹27,000 Cr – ₹6,000 Cr = ₹21,000 Cr
- Shows cash available after maintaining business operations
- Cash Flow to Net Income Ratio = Operating Cash Flow ÷ Net Income
- For Infosys: ₹27,000 Cr ÷ ₹22,000 Cr = 1.23
- Should be close to or above 1 (higher is better)
Red Flags to Watch For:
- Consistently negative operating cash flow
- Large gap between reported profits and operating cash flow
- Heavy reliance on external financing for operations
- Declining free cash flow despite increasing profits
5. Key Financial Ratios to Calculate
| 📈 Ratio | 📘 Meaning | ✅ Good Value |
|---|---|---|
| 🔹 P/E Ratio | How expensive the stock is compared to earnings | Below 25 (compare with industry peers) |
| 🔹 Debt-to-Equity | Financial risk from borrowed money | Less than 1 is generally safe |
| 🔹 ROE | Return on shareholders' equity | Above 15% shows strong performance |
| 🔹 Current Ratio | Short-term financial stability | Greater than 1.5 is healthy |
| 🔹 Operating Margin | Profitability from core operations | Higher is better, compare with industry |
| 🔹 Cash Flow to Net Income | Quality of earnings | Close to or above 1 |
Let’s understand each ratio:
1. P/E Ratio (Price-to-Earnings)
Formula: Share Price ÷ Earnings Per Share
- Tells how costly the stock is
- Lower is usually better, but always compare with industry peers
- Example: TCS at P/E 28 vs Industry average of 22 means it’s trading at a premium
2. Debt-to-Equity
Formula: Total Debt ÷ Shareholders’ Equity
- Shows how much debt the company carries
- Lower D/E = less financial risk
- Example: Tata Motors with D/E of 1.5 has higher risk than Infosys with D/E near zero
3. ROE (Return on Equity)
Formula: Net Profit ÷ Shareholders’ Equity
- Tells how efficiently the company uses shareholder money
- Higher ROE = better returns on investment
- Example: HDFC Bank’s ROE of 16% is strong for banking industry
4. Current Ratio
Formula: Current Assets ÷ Current Liabilities
- Shows if the company can pay short-term obligations
- Higher than 1.5 is financially healthy
- Example: Asian Paints with Current Ratio of 2.1 has excellent liquidity
5. Operating Margin
Formula: Operating Profit ÷ Revenue × 100%
- Shows profitability from core business operations
- Higher margins indicate pricing power and efficiency
- Example: Nestle India’s 22% operating margin shows strong pricing power
6. Cash Flow to Net Income Ratio
Formula: Operating Cash Flow ÷ Net Income
- Ratio close to 1 means profits are backed by real cash
- Higher than 1 is excellent (generating more cash than reported profit)
- Example: TCS with ratio of 1.2 has high-quality earnings
📌 Remember: These ratios work best when used together and compared across a few years to spot trends!
Want to take your stock research even further? Discover how top investors find winning stocks using free tools and smart filters.
👉 Read: How to Find the Best Stocks to Beat the Market
6. How to Analyze All Three Statements Together
Case Study: Comparing Two Companies
| Metric | Company A | Company B | Winner |
|---|---|---|---|
| Net Profit | ₹500 Crore | ₹400 Crore | Company A |
| Profit Margin | 12% | 20% | Company B |
| Debt-to-Equity | 2.5 | 0.8 | Company B |
| Operating Cash Flow | ₹300 Crore | ₹450 Crore | Company B |
| FCF to Net Income | 0.4 | 1.1 | Company B |
Despite Company A showing higher absolute profits, Company B demonstrates superior operational efficiency, financial stability, and cash generation—making it potentially the better investment.
7. Practical Tools for Financial Analysis
8. 15-Minute Financial Analysis Framework
Step 1: Quick Overview (2 minutes)
- Check business model and industry position
- Review key headlines from recent earnings reports
Step 2: Balance Sheet Analysis (4 minutes)
- Check Debt-to-Equity ratio trend over 3-5 years
- Evaluate Current Ratio for liquidity
- Look for red flags in asset/liability growth
Step 3: P&L Analysis (4 minutes)
- Analyze revenue growth rate (quarter-on-quarter and year-on-year)
- Check profit margin trends (gross, operating, net)
- Compare revenue growth vs. expense growth
Step 4: Cash Flow Analysis (4 minutes)
- Verify operating cash flow is positive and growing
- Calculate free cash flow and its trend
- Compare operating cash flow to reported net profit
Step 5: Final Assessment (1 minute)
- Assign scores to each area (Balance Sheet, P&L, Cash Flow)
- Make preliminary investment decision or flag for deeper research
9. Real-World Application: Decoding Annual Reports
Annual reports contain valuable information beyond just numbers. Here’s what to look for:
Management Discussion & Analysis (MD&A)
- Industry trends and competitive positioning
- Management’s explanation of financial results
- Forward-looking statements about growth strategies
Notes to Financial Statements
- Accounting policies that might affect reported numbers
- Segment-wise performance breakdown
- Related party transactions
- Contingent liabilities
Auditor’s Report
- Look for “unqualified” (clean) audit opinion
- Pay attention to any qualifications or emphasis of matter
10. Conclusion
Understanding financial statements is not just for accountants — it’s a critical skill for every Indian investor who wants to build long-term wealth and avoid risky companies. The Balance Sheet, Profit & Loss Statement, and Cash Flow Statement together give you a complete X-ray of a company’s financial health.
✅ The Balance Sheet helps you judge stability and capital structure.
✅ The Profit & Loss Statement shows how efficiently the company earns profits.
✅ The Cash Flow Statement reveals the company’s real liquidity and operational strength.
By learning to read these three statements together, you gain the power to:
- Identify strong businesses worth investing in 📊
- Avoid companies hiding problems behind inflated profits 🚫
- Make confident, fact-based investment decisions ✅
And the best part? You can start applying this knowledge in just 15 minutes using real-world tools like Screener.in, Tickertape, or Trendlyne — no CA background needed!
11. Disclaimer
The information in this blog is for educational purposes only. Stock names and financial data are based on current trends and do not constitute investment advice.
📌 Stock market investments involve risks, and actual performance may vary.
📌 Always consult a certified financial advisor before making investment decisions.
This blog does not provide personalized investment advice. Investors should conduct their own research before investing.
✅ Liked this article? Share it with your friends!
Do you invest in stocks? Let us know your experience in the comments below! 🚀
12. FAQs
Which financial statement should I analyze first?
Start with the P&L for a quick overview of profitability, then move to Cash Flow to verify the quality of earnings, and finally check the Balance Sheet for financial stability.
How can I spot potential accounting fraud?
Look for these warning signs:
- Growing gap between profits and operating cash flow
- Unusual accounting policies or frequent changes
- Consistently meeting/beating analyst estimates by small amounts
- Complex corporate structures or numerous related-party transactions
What's the difference between EBITDA and net profit?
EBITDA (Earnings Before Interest, Taxes, Depreciation, and Amortization) measures operational performance without the impact of financing decisions, tax environments, and non-cash expenses. Net profit is the final profit after all expenses, including interest, taxes, and non-cash items.
How often should I review a company's financials?
Quarterly for companies you’ve invested in, and semi-annually or annually for companies on your watchlist. Always review before making new investments or increasing existing positions.
Do different industries have different financial statement norms?
Absolutely! Banking, real estate, manufacturing, and technology companies all have industry-specific metrics and ratios. Always compare companies within the same sector using industry-appropriate benchmarks.
13. Next Steps in Your Financial Learning Journey
- Practice with Real Companies: Pick 3-5 companies from different sectors and analyze their financials
- Read Annual Reports: Start with small companies (less than 100 pages) and gradually move to more complex ones
- Join Investment Communities: Participate in online forums where investors discuss financial analyses
- Take Free Courses: Many platforms offer free courses on financial statement analysis
- Follow Expert Analysts: Subscribe to quality research from established analysts
Remember, financial analysis is a skill that improves with practice. Start small, be consistent, and gradually build your expertise.
🔄 Interactive Learning: Test Your Knowledge
Challenge yourself:
- Find a company’s latest annual report
- Calculate 3 key ratios from each financial statement
- Identify one strength and one concern from each statement
- Make a preliminary investment assessment based on your findings
Share your analysis with fellow investors to get feedback and different perspectives!
✅ Liked this article? Share it with your friends!
Do you read financial statements before investing? Let us know your experience in the comments below! 🚀
Ready to transform from a speculative investor to a research-driven investor? The journey starts with understanding financial statements.