How to Find and Analyze the Best Stocks
Are you tired of guessing which stock will give you multibagger returns? 📉📈
Do you feel confused watching 100s of stock tips on YouTube and social media—yet still don’t know what to buy?
You’re not alone.
Thousands of Indian investors lose money every year—not because they lack money, but because they lack a system to find the right stocks.
But what if you could confidently pick winning stocks using simple, research-backed methods?
✅ No guesswork.
✅ No tips.
✅ Just powerful stock-picking strategies used by India’s top investors (and mutual funds).
In this beginner-friendly blog, I’ll show you exactly how to:
- Find great Indian stocks on your own
- How to Find Best Stocks
- Use free tools like Screener, Trendlyne, Moneycontrol, etc.
- Avoid common traps like overhyped or low-quality stocks
- Build a solid portfolio step-by-step
Let’s turn your confusion into confidence. Ready to pick your first winning stock? 🚀
👉 Let’s begin!
Topics Covered
1. What Does "Best Stock" Mean?
There’s no “one best stock” for everyone.
✅ For some, the best stock is stable and low-risk (e.g. HDFC Bank, Infosys).
✅ For others, it’s a fast-growing company with high returns (e.g. ZOMATO, BSE)
Your “best stock” depends on your:
- Risk appetite
- Investment goals (growth, income, safety)
- Time horizon (1 year vs. 10 years)
- Research skills
💡 Note: There’s no magic formula — but you can increase your success rate with proper analysis!
2. What is Stock Analysis?
Stock analysis is like a medical check-up before investing your money.
You review a company’s financial health, business model, management quality, industry trends, and its future potential. This helps you avoid risky investments and pick companies that can grow your wealth.
3. Why Finding the Right Stock Matters
✅ You’re not just buying a stock; you’re buying a business.
✅ Right stocks give long-term wealth.
✅ Not all stocks grow: Some go up 10x (multibaggers), while others crash.
✅ A good company = higher returns with lower risk
✅ A bad company = wealth erosion and sleepless nights
Example:
Someone who invested ₹1 lakh in Infosys in 2000 would have over ₹60+ lakh today — without any active trading.
That’s the power of selecting the right stock early.
4. Key Financial Ratios to Analyze the Best Stocks.
| 📈 Ratio | 📘 Meaning | ✅ Good Value |
|---|---|---|
| 📊 P/E Ratio | How expensive the stock is | Below 25 (Compare peers) |
| 📉 Debt-to-Equity | Financial risk from debt | Less than 1 is safe |
| 💼 ROE | Return on shareholders’ equity | Above 15% is strong |
| 💧 Current Ratio | Liquidity for short-term needs | Greater than 1.5 |
| 💵 Free Cash Flow | Cash left after expenses | Should be Positive |
| 👨💼 Promoter Holding | Promoter's confidence in company | Above 50% preferred |
| 📌 Tip: Use these ratios together to judge a company's true financial health — not just stock price! 🚀 | ||
Let’s Understand Each Key Financial Ratio One by One
1.P/E Ratio (Price to Earnings)
Formula: Share Price ÷ Earnings Per Share
➡️ Tells how costly the stock is.
✅ Lower is usually better, but always compare with other companies in the same industry.
2.Debt-to-Equity (D/E)
Formula: Total Debt ÷ Shareholders’ Equity
➡️ Shows how much debt the company has.
✅ Lower D/E = less risk for investors.
3.ROE (Return on Equity)
Formula: Net Profit ÷ Shareholders’ Equity
➡️ Tells how well the company uses your invested money to make profit.
✅ Higher ROE = better returns.
4. Current Ratio
Formula: Current Assets ÷ Current Liabilities
➡️ Shows if the company can pay short-term bills.
✅ Higher than 1.5 is financially healthy.
5. Free Cash Flow
➡️ Money left after all expenses and investments.
✅ Positive cash flow = company is generating real profit.
6. EPS Growth (Earnings Per Share Growth)
➡️ Tracks how the company’s profits per share grow every year.
✅ Consistent growth = strong business performance.
7. Promoter Holding
➡️ % of company shares owned by founders/promoters.
✅ Higher holding = more trust and long-term vision.
📊 Keep track of any increase or decrease in promoter holding.
5. Quick Checklist Before You Buy a Stock
✅ Is the company profitable for the last 5 years?
✅ Are sales and profits growing?
✅ Is ROE/ROCE above 15%?
✅ Is the company low in debt?
✅ Is promoter holding stable or increasing?
✅ Are mutual funds investing in it?
If most answers are YES — it’s a green signal to study further.
6. Red Flags to Avoid While Selecting Stocks
❌ Companies with huge debt
❌ Sudden drop in promoter holding
❌ Regular pledging of promoter shares
❌ Consistent losses or negative cash flow
❌ Companies under SEBI investigation or fraud alert
❌ Blindly following tips from Telegram/YouTubers
❌ Buying just because price is low (cheap is not always good)
❌ Ignoring debt & promoter pledging
❌ Buying based on emotion, not logic
❌ Ignoring macro-economic changes or sector performance
💡 Remember: Research is your only weapon in the market.
Avoid “hot tips” or YouTube hype without checking fundamentals!
👉 New to investing? It’s important to know who really moves the market. Don’t miss this eye-opening article 4 Big Players Who Control the Indian Stock Market.
7. How to Analyze a Company
📚 Fundamental Analysis
Focus on company health, financials & growth potential.
📊 Key Metrics
ROE, P/E Ratio, Free Cash Flow, Debt-to-Equity, Promoter Holding.
🛠️ FA Tools
Screener.in, Trendlyne, Moneycontrol, NSE/BSE.
📈 Technical Analysis
Identify when to buy/sell using charts & indicators.
📉 Key Indicators
RSI, MACD, Moving Averages, Candlesticks, Support/Resistance.
🔧 TA Tools
TradingView, Chartink, Investing.com, Trendlyne Charts.
We can analyze a company in two ways: fundamental analysis and technical analysis.
1.Fundamental Analysis
Let’s break it down into 3 major pillars:
A. Quantitative Analysis This includes numbers:
• Debt levels
• Revenue, profits, and margin growth
• Debt-to-equity ratio
• Promoter shareholding
• Return on equity (ROE)
• Free cash flow
B. Qualitative Analysis This includes:
• What does the company do?
• Is the management trustworthy?
• Is the brand well-known?
• Is it a market leader or a small player?
• Is the industry growing?
• Brand strength (e.g. Asian Paints)
• Market leadership (e.g. Maruti in cars)
• Management quality (e.g. HDFC, Infosys)
C. Valuation Metrics Check if the stock is overpriced or undervalued using:
• P/E Ratio
• Price to Book (P/B) Ratio
• PEG Ratio (Price/Earnings to Growth)
📌 Example: Two companies may be growing at 15%, but one is trading at P/E 50 and the other at P/E 20. The latter is more reasonably priced!
Best Free Tools for Fundamental Analysis
2.Technical Analysis: Timing the Right Entry & Exit
While Fundamental Analysis tells you “what” stock to buy, Technical Analysis helps you decide “when” to buy or sell. It’s like reading the mood of the market using charts and indicators.
🔍 What is Technical Analysis?
It’s the study of price charts, volume, and patterns to predict future stock movements.
💡 Think of it like weather forecasting. It doesn’t guarantee outcomes, but increases your chances of being right based on patterns.
📊 Key Tools in Technical Analysis:
1️.Candlestick Charts
Show opening, closing, high, and low prices in a visual format.
2️.Support & Resistance
Support: A price level where buyers step in.
Resistance: A price level where sellers dominate.
3️.Moving Averages (MA)
Simple Moving Average (SMA) or Exponential MA (EMA) smooth out price action.
💡 Tip: A 50-day EMA crossing above a 200-day EMA = Bullish signal (Golden Cross)
4️.Relative Strength Index (RSI)
A momentum indicator.
Above 70 = Overbought | Below 30 = Oversold
5️.MACD (Moving Average Convergence Divergence)
Helps confirm trend reversals and entry/exit signals.
Example
You’ve identified Infosys as a fundamentally good stock.
Now check:
- Is the price near a strong support?
- Is RSI between 40–50 (neutral or slightly oversold)?
- Has volume increased on green candles?
If yes, it could be a good technical entry point.
🧠 Pro Tip: Combine technical analysis with fundamental strength — this increases your success probability.
Confused between investing and trading? Don’t worry—this article will clear your doubts:
📖 Investing vs Trading: Which One is Best for You?
8. Step-by-Step Guide to Find Good Stocks
✅ Beginner-Friendly Process for Fundamental Stock Analysis
Step 1: Define Your Goal
→ Are you aiming for long-term wealth creation or short-term gain?
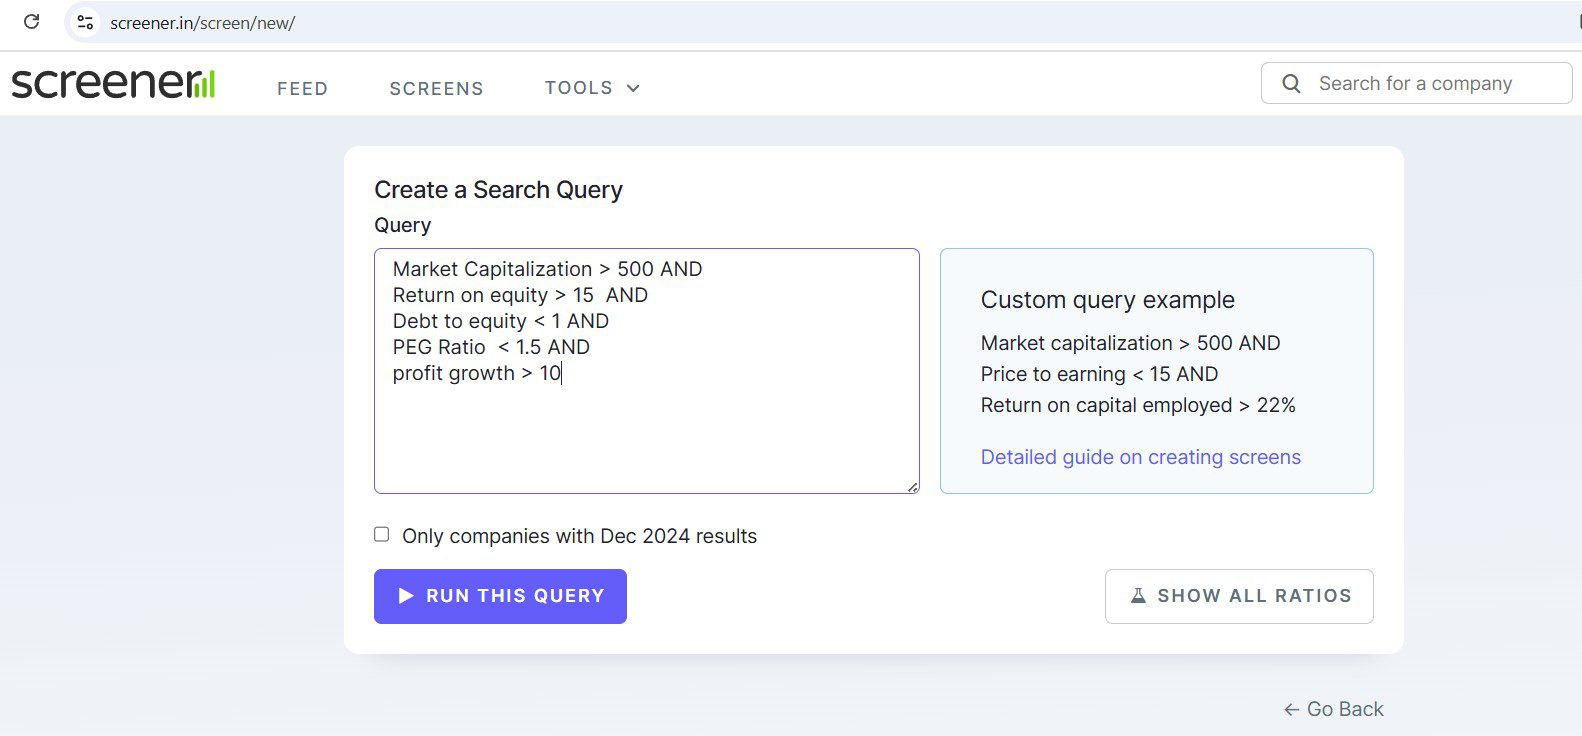
Step 2: Screen Stocks
Visit Screener.in and use the following filter:
- Market Capitalization > 500 AND
- Return on equity > 15 AND
- Debt to equity < 1 AND
- PEG Ratio < 1.5 AND
- profit growth > 10
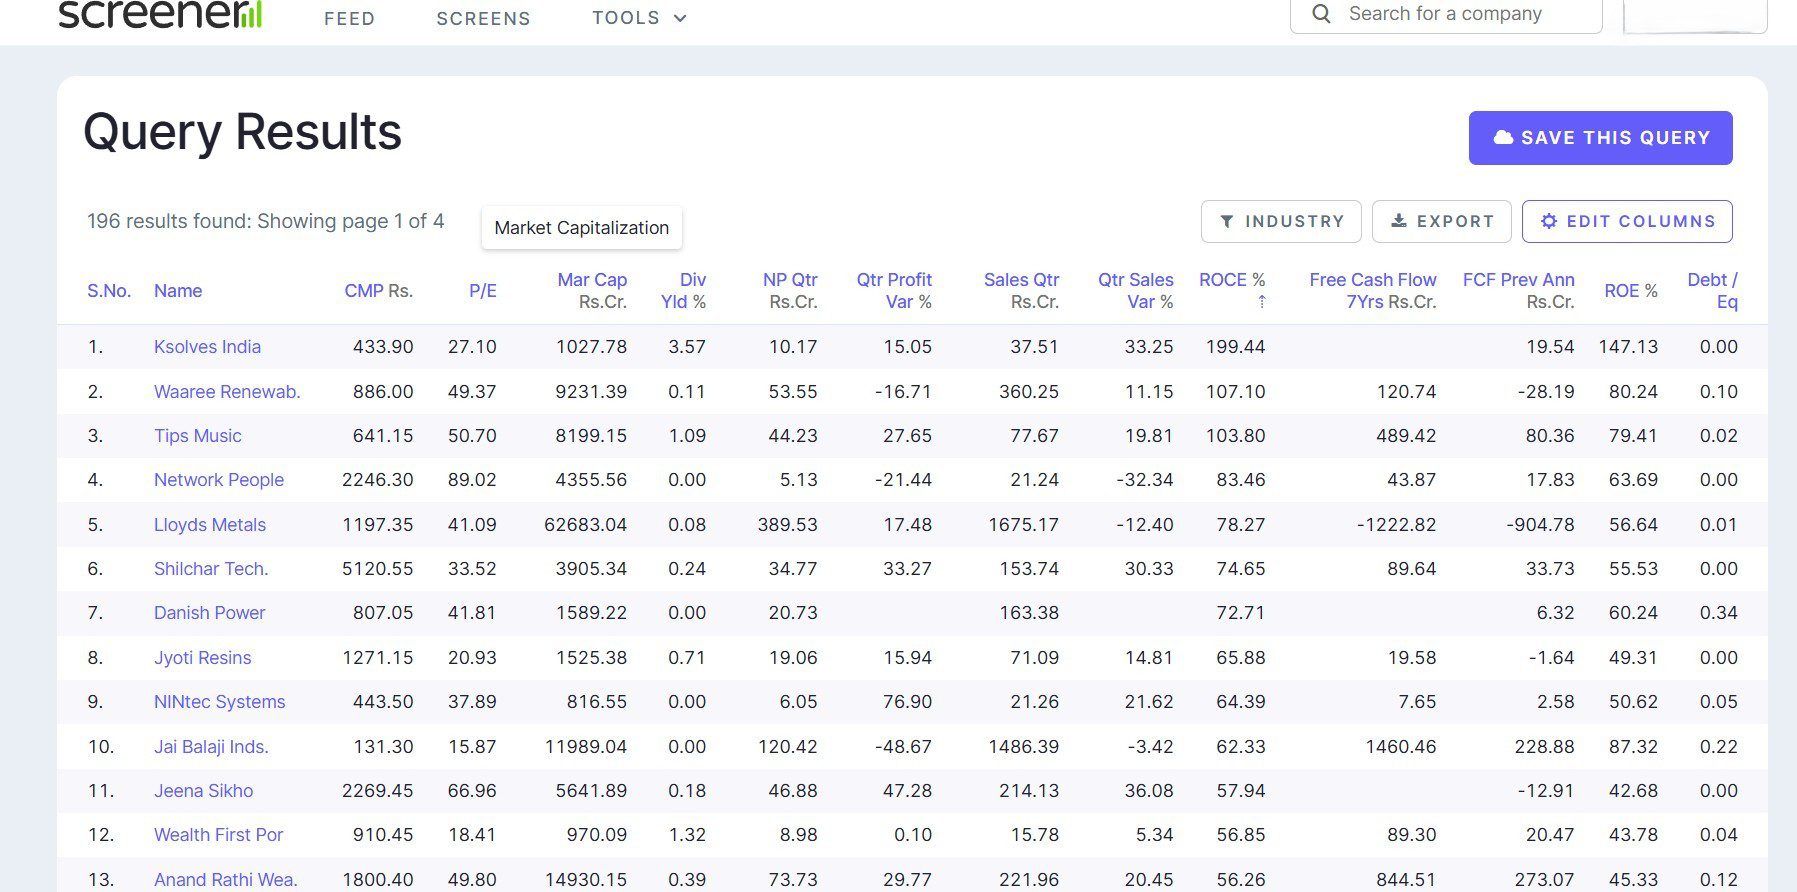
📌 You’ll now get a list of consistent, fundamentally strong companies!
✅ Sample Companies That Often Show Up:
- Ksolves India
- Waaree Renewables
- Tips Music
- Network People
- Lloyds Metals
💡 Note: These are just examples — always verify with the latest financials.
Step 3: Check the Business Model
→ Is the company easy to understand? Does it solve a real-world problem?
Step 4: Read Financials
→ Look at profit growth, sales growth, and debt trends over the last 5–10 years.
Step 5: Check Revenue & Profit Growth
→ Look for consistent growth of 10–15% CAGR over the past 5–10 years.
Step 6: Analyze Debt Levels
→ Use the Debt-to-Equity ratio. Prefer companies with low or zero debt.
🟢 Example: Infosys has very low debt.
Step 7: Look at ROE & ROCE
→ ROE (Return on Equity) > 15% is strong.
→ ROCE > 15% indicates efficient use of capital.
Step 8: Compare P/E Ratio
→ Check P/E relative to peers.
⚠ High P/E isn’t always bad — just avoid overpaying.
Step 9: Check Promoter Holding
→ Higher promoter holding = higher trust.
🚫 Avoid companies with consistent promoter selling.
Step 10: Read Annual Reports
→ Go through the company’s annual reports — they include financials, plans, and risk factors.
Step 11: Analyze Cash Flow
→ Focus on companies generating real cash, not just profits on paper.
Step 12: Assess Management
→ Are the promoters trustworthy? What’s their reputation and track record?
Step 13: Compare with Peers
→ How does the company perform against competitors in the same industry?
Step 14: Look at Valuation
→ Is the stock overvalued or undervalued compared to the industry average?
Step 15: Monitor Regularly
→ Track quarterly results, company news, and promoter holding changes.
Let’s apply the analysis steps to TCS, one of India’s leading IT company:
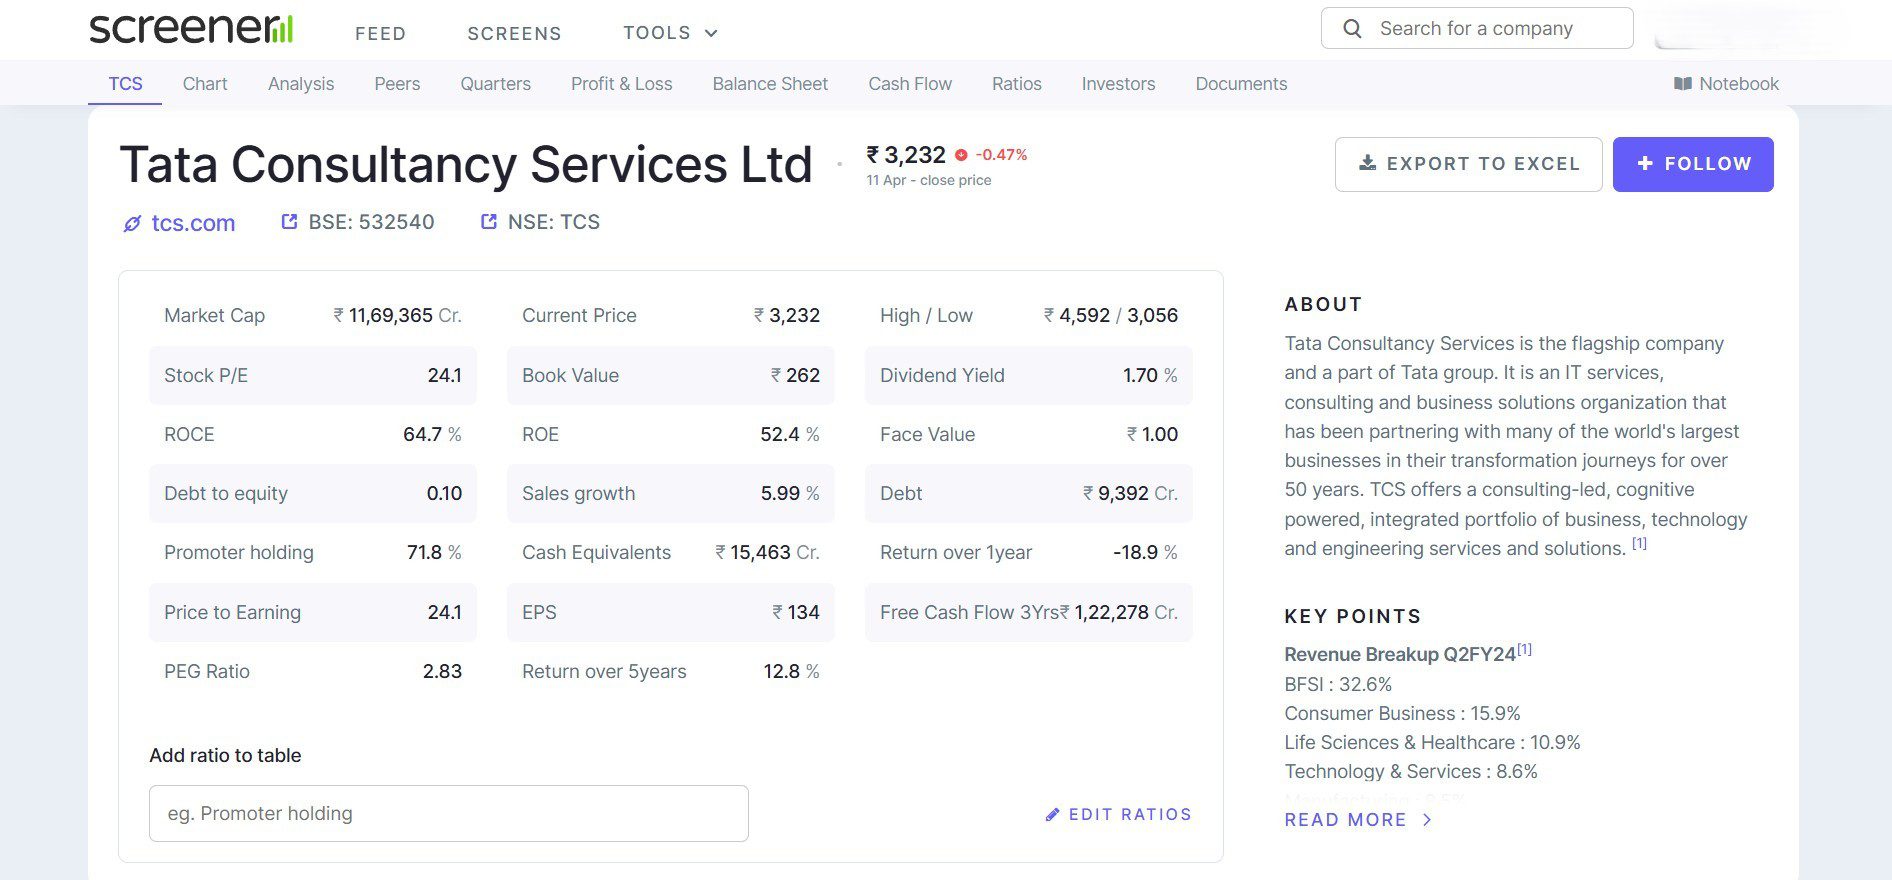
🔍 How to Analyze TCS on Screener.in (Step-by-Step)
Visit 👉 Screener.in and follow these simple steps to evaluate Tata Consultancy Services (TCS):
🔎 Step 1: Search the Company
- Go to the search bar and type “TCS”
- Click on Tata Consultancy Services Ltd
📘 Step 2: Understand the Business Model
- Read the “About” section on top
- TCS provides IT services, consulting, and outsourcing to clients globally
📈 Step 3: Check Revenue & Profit Growth
Scroll down to the Financials section:
- Look at the Revenue and Net Profit trends over the last 5–10 years
- You’ll see consistent CAGR of 11–12% over a decade
📉 Step 4: Analyze Debt Levels
- Under Balance Sheet, check Debt-to-Equity Ratio
- TCS shows nearly zero debt — excellent financial discipline ✅
📊 Step 5: Review ROE (Return on Equity)
- Scroll to Ratios
- ROE is above 50% — a very strong sign of capital efficiency
💡 Step 6: Compare P/E Ratio
- Look under Valuation Ratios
- TCS P/E is around 24, slightly above the industry average (~22)
- Premium is due to brand strength and performance consistency
👥 Step 7: Promoter Holding
- Under the Shareholding tab
- Promoter Holding: ~71.77% — shows strong promoter confidence
💰 Step 8: Check Free Cash Flow
- Scroll to Cash Flow Statement
- Look for “Free Cash Flow” — consistently positive = excellent sign for long-term investors
✅ Final Thoughts
TCS passes all major fundamental checks on Screener.in:
- Solid growth
- Low risk
- Excellent cash flow
- Strong promoter backing
This is how you can analyze any listed company with real data. Screener.in makes it beginner-friendly!
🔍 Want to build a balanced portfolio? Learn the 6 powerful secrets of investing in Small-Cap, Mid-Cap & Large-Cap Stocks.
9. Conclusion
Finding the best stocks to invest in is not gambling—it’s a skill.
By following a disciplined process, using the right tools, and analyzing both qualitative & quantitative factors, you can build a portfolio that grows wealth consistently
✅ Use fundamental & qualitative research
✅Check financial ratios, debt, promoter trust
✅ Compare with peers using tools like Screener & Trendlyne
✅Read company reports and understand the business
✅Avoid hype — focus on facts
💡 Final Advice: “Don’t just buy stocks. Buy businesses you understand.”
10. Disclaimer
The information in this blog is for educational purposes only. Stock names and financial data are based on current trends and do not constitute investment advice.
📌 Stock market investments involve risks, and actual performance may vary.
📌 Always consult a certified financial advisor before making investment decisions.
This blog does not provide personalized investment advice. Investors should conduct their own research before investing.
✅ Liked this article? Share it with your friends!
Do you invest in stocks? Let us know your experience in the comments below! 🚀
11. Frequently Asked Questions (FAQs)
What is the best tool for stock analysis in India?
Screener.in is widely used by Indian investors. It provides financials, ratios, and comparison features in a clean, easy-to-understand format.
How many years of financial data should I check?
Look at at least 5–10 years of financials. This helps you understand if the company has been consistently growing or just had a good recent year.
Can beginners invest without doing deep analysis?
Yes, but it’s better to invest in mutual funds or ETFs if you can’t analyze stocks. Or learn gradually and start with strong large-cap stocks.
What are the best stocks to start with for beginners?
Start with large-cap stocks like HDFC Bank, TCS, Infosys, or Hindustan Unilever. These companies have consistent growth and low risk.
Should I invest in stocks suggested on YouTube or social media?
No. Always verify fundamentals yourself. Don’t follow hype or “tips” without research — it can lead to losses.
How do I know if a stock is undervalued?
Check its P/E ratio compared to its peers. Use the PEG ratio for better clarity. If PEG < 1, the stock may be undervalued.
Are high P/E stocks always bad?
Not necessarily. High-quality companies often trade at high P/E due to investor trust. But make sure growth justifies valuation.
Can beginners pick stocks successfully?
Yes, with patience and proper research. Start with sectors you understand and use checklists. Also, track what mutual funds are buying for guidance.
Can I invest in high P/E stocks?
Only if the company has strong growth potential (e.g. Asian Paints, D-Mart). High P/E is not always bad.