How to Understand Company Financial Reports: Smart Investor’s Secret
Have you ever felt completely lost when someone talks about “balance sheets” or “cash flows”? You’re definitely not alone!
Every day, millions of Indians invest their hard-earned money without understanding the basic financial reports that could protect their wealth. The good news? You don’t need an MBA or accounting background to Understand Company Reports and master this essential skill.
This guide breaks down company financial statements into such simple, everyday language that even a 12th standard student could understand them. By the end, you’ll be able to:
✅ Spot the difference between truly successful companies and ones heading for trouble
✅ Protect your investments from companies hiding financial problems
✅ Feel confident when discussing investments with anyone
✅ Make smarter decisions with your money
Let’s turn confusing financial jargon into plain, simple language you’ll actually enjoy using!
WHAT YOU'LL LEARN
1. Financial Statements: What They Actually Are (In Plain English)
Imagine you’re thinking about buying a car. Before purchasing, you’d want to know:
Is it in good condition? How well does it run?
Does it have a history of breaking down?
Financial statements answer similar questions about companies, just with numbers.
The Three Main Financial Reports (And What They Really Tell You):
🔹 Balance Sheet: What the company owns vs. what it owes (like checking someone’s bank balance and credit card bills)
🔹 Profit & Loss (P&L): How much money the company made and spent (like looking at someone’s salary and expenses)
🔹 Cash Flow Statement: The actual money moving in and out (like watching someone’s actual wallet, not just what they claim)
REAL-WORLD EXAMPLE:
Think of a friend who brags about making ₹1 lakh per month but is always borrowing money. Their “profit” (what they say they make) sounds impressive, but their “cash flow” (actual money in hand) tells a different story!
Companies work the same way. Some look rich on paper but have empty bank accounts in reality.
2. Why Understanding These Reports Can Save Your Money
Financial statements aren’t just boring paperwork—they’re your early warning system for financial disasters.
Stories of Real People Who Wished They’d Known Better:
🔸 The Yes Bank Tragedy: Thousands of ordinary Indians lost their savings when Yes Bank collapsed in 2020. The warning signs were hiding in plain sight in their financial reports for over a year—showing rapidly increasing bad loans and decreasing cash reserves.
🔸 The Jet Airways Surprise: When Jet Airways suddenly shut down in 2019, many investors were shocked. But those who checked its cash flow statement weren’t surprised at all—the company had been bleeding cash for years despite reporting “profits.”
What These Reports Help You Do:
✅ Avoid companies that might go bankrupt
✅ Find businesses that are actually growing, not just claiming to grow
✅ Understand if a company can afford to pay dividends
✅ See if a company is drowning in debt
EVERYDAY COMPARISON:
This is like checking a restaurant’s kitchen before eating there. Clean, well-organized kitchens (strong financials) usually mean good food (good investments). Dirty kitchens with expired ingredients (poor financials) often lead to food poisoning (investment losses).
The balance sheet is like a snapshot of someone's financial health on a specific day.
The Simple Formula Everyone Should Know:
What the Company OWNS = What the Company OWES + What the Owners' Share Is Worth
Or in financial terms:
Assets = Liabilities + Shareholders' Equity
Let's Break This Down With a House Example:
Imagine you buy a house worth ₹50 lakhs: You pay ₹10 lakhs from your savings You take a loan of ₹40 lakhs from the bank
In financial terms:
- Asset: House (₹50 lakhs)
- Liability: Bank loan (₹40 lakhs)
- Your Equity: Your own money invested (₹10 lakhs)
Now Let's Look at a Real Company:
Maruti Suzuki's simplified balance sheet:
| What They Own (Assets) | Amount | What They Owe (Liabilities) | Amount |
|---|---|---|---|
| Cash & Investments | ₹46,000 Cr | Short-term Dues | ₹15,000 Cr |
| Inventory & Receivables | ₹15,000 Cr | Long-term Loans | ₹1,000 Cr |
| Factories & Equipment | ₹36,000 Cr | Shareholders' Equity | ₹81,000 Cr |
| TOTAL | ₹97,000 Cr | TOTAL | ₹97,000 Cr |
What This Tells Even a Beginner:
- Maruti has very little debt (only ₹1,000 Cr long-term loans)
- They have lots of cash (₹46,000 Cr)
- They're in a strong position to survive tough times
RED FLAG EXAMPLE: Compare this to Vodafone Idea, which owes much more than its total equity—a dangerous position if business slows down.
SIMPLE RULE OF THUMB: Companies with more assets than debts, and plenty of cash, are generally safer investments.
4. The Profit & Loss Statement: Is The Company Actually Making Money?
The P&L statement is like your salary slip and expense record combined—showing if a company is bringing in more money than it's spending.
The Super Simple Formula:
Money Coming In - Money Going Out = Profit (or Loss)
Or in business terms:
Revenue - Expenses = Net Profit
Real-Life Comparison:
Imagine two street food vendors:
- Vendor A:
Sells 100 plates daily at ₹100 each = ₹10,000 daily revenue
Daily expenses (ingredients, rent, etc.) = ₹8,000
Daily profit = ₹2,000
Profit margin: 20% (₹2,000 ÷ ₹10,000) - Vendor B:
Sells 200 plates daily at ₹100 each = ₹20,000 daily revenue
Daily expenses = ₹19,000
Daily profit = ₹1,000
Profit margin: 5% (₹1,000 ÷ ₹20,000)
Which business is healthier? Vendor A makes less money overall but keeps more of what they earn.
Now Let's Compare Two Real Companies:
| 📊 P&L Item | 🏢 Asian Paints | 🏢 Berger Paints |
|---|---|---|
| Total Sales | ₹29,000 Cr | ₹9,000 Cr |
| Raw Material Costs | ₹15,500 Cr | ₹5,200 Cr |
| Employee Costs | ₹1,800 Cr | ₹700 Cr |
| Other Expenses | ₹5,700 Cr | ₹1,800 Cr |
| Net Profit | ₹4,400 Cr | ₹1,000 Cr |
| Profit Margin | 15.2% | 11.1% |
What This Tells a Non-Financial Person:
- Asian Paints is larger (3x more sales)
- Asian Paints keeps more of each rupee as profit (15.2% vs 11.1%)
- Asian Paints is more efficient at turning sales into actual profit
PRACTICAL TIP: Look for companies that maintain or improve their profit margins over several years—they're usually better at managing their business.
5. The Cash Flow Statement: Is The Money Real Or Just On Paper?
The cash flow statement is the truth-teller that shows actual money movement—not just accounting profits.
Why This Matters in Everyday Terms:
Imagine you run a small shop:
You sell ₹50,000 worth of products this month But customers only paid ₹30,000 in cash
The remaining ₹20,000 is “on paper” until they pay
Your “profit” might look good, but you can’t pay your rent with “on paper” money!
The Three Parts of Cash Flow (Explained Simply):
- Operating Cash Flow: Money from day-to-day business Example: Cash from selling products or services
- Investing Cash Flow: Money spent or received from buying/selling assets Example: Buying new machines or property
- Financing Cash Flow: Money from loans, repayments, or shareholder transactions Example: Getting a bank loan or paying dividends
Real Company Example: The Downfall of Jet Airways
| 📅 Year | 📉 “Paper” Profit/Loss | 💸 Actual Cash Flow from Operations |
|---|---|---|
| 2016 | ₹1,212 Cr Profit | ₹(126) Cr Cash Loss |
| 2017 | ₹438 Cr Profit | ₹(340) Cr Cash Loss |
| 2018 | ₹(636) Cr Loss | ₹(1,048) Cr Cash Loss |
Jet Airways was reporting profits when it was actually losing cash. This eventually led to its complete shutdown.
🧠 THE ONE RULE EVERYONE SHOULD REMEMBER:
A company might report good profits, but if it doesn't generate positive cash from operations over time, those profits may be imaginary.
6. The Simple Comparison Chart (Financial Statements At A Glance)
| ❓ If You Want To Know... | 📄 Look At This Statement | 🧠 The Key Question It Answers |
|---|---|---|
| Is the company drowning in debt? | Balance Sheet | "Does the company own more than it owes?" |
| Is the business actually profitable? | Profit & Loss | "Is the company making money after all expenses?" |
| Can the company pay its bills? | Cash Flow | "Is real money coming in to cover expenses?" |
Which Statement Matters Most?
Think of it this way:
- Balance Sheet: The company's financial health 🏥
- Profit & Loss: The company's ability to make money 💸
- Cash Flow: Confirmation that the money is real 💵
💡 Important: All three matter because a problem in any one can sink a company 🚨.
7. Where To Find These Reports (Even If You're A Complete Beginner)
Finding financial statements is easier than you might think!
8. Real-Life Example: Breaking Down Tata Motors' Money Situation
Let's analyze Tata Motors using simple language anyone can understand:
📋 Balance Sheet Snapshot:
| What Tata Motors Owns | What Tata Motors Owes |
|---|---|
| Cash: ₹50,000 Cr | Short-term Dues: ₹80,000 Cr |
| Factories & Equipment: ₹90,000 Cr | Long-term Loans: ₹100,000 Cr |
| Other Assets: ₹160,000 Cr | Shareholders' Equity: ₹120,000 Cr |
What This Tells Us:
- Tata Motors has significant debt (₹180,000 Cr total).
- Its debt is higher than its equity (not ideal).
- Its cash covers only part of short-term obligations.
📈 Profit Story (P&L):
| Item | FY 2023 Amount | Compared to Previous Year |
|---|---|---|
| Total Sales | ₹350,000 Cr | ↑ 15% |
| Expenses | ₹320,000 Cr | ↑ 12% |
| Net Profit | ₹30,000 Cr | ↑ 35% |
What This Tells Us:
- Sales are growing (good sign).
- Profits are growing faster than sales (excellent sign).
- The company is becoming more efficient.
💵 Cash Reality Check:
| Cash Flow Category | Amount | What It Means |
|---|---|---|
| From Operations | ₹40,000 Cr | Core business generates cash (positive) |
| From Investing | ₹(35,000) Cr | Investing in future growth (normal) |
| From Financing | ₹(5,000) Cr | Paying down some debt (good) |
The Non-Financial Person's Conclusion:
- Tata Motors is a profitable company with strong sales growth.
- It carries significant debt (a risk).
- It’s generating enough cash to cover operations and invest in growth while slowly reducing debt.
- This is generally positive but requires monitoring the debt situation.
9. Warning Signs That Anyone Can Spot (No Finance Degree Needed)
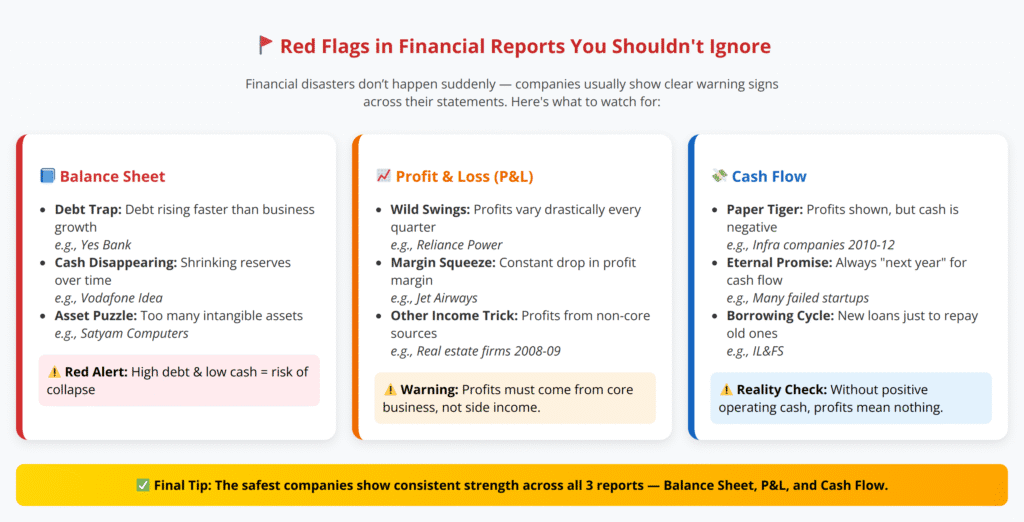
Financial disasters rarely happen without warning. Here are simple red flags anyone can spot:
Balance Sheet Warning Signs:
🚩 The Debt Trap: When a company’s debt keeps growing much faster than its business
Real Example: Yes Bank’s loans grew 80% in two years while its ability to handle them deteriorated
🚩 The Disappearing Cash: When cash reserves keep shrinking quarter after quarter
Real Example: Vodafone Idea’s cash dropped from ₹20,000 Cr to ₹3,000 Cr while debt remained high
🚩 The Asset Puzzle: When “intangible assets” (things you can’t touch) make up most of the company’s value
Real Example: Satyam Computers claimed to have ₹5,040 Cr in bank balances that didn’t actually exist
Profit & Loss Warning Signs:
🚩 The Wild Swing: Profits that jump up and down dramatically each quarter
Real Example: Reliance Power showed erratic profit patterns before its stock crashed 95%
🚩 The Margin Squeeze: When profit margins keep declining year after year
Real Example: Jet Airways saw margins shrink for three consecutive years before collapse
🚩 The Other Income Trick: When a large portion of profit comes from “other income” not related to main business
Real Example: Many real estate companies during 2008-09 showed profits from investments while their core business was losing money
Cash Flow Warning Signs:
🚩 The Paper Tiger: Companies reporting profits but showing negative operating cash flows
Real Example: Many infrastructure companies in 2010-2012 reported profits while burning cash
🚩 The Eternal Promise: Companies that never generate positive cash flow but always claim “next year will be different”
Real Example: Many new-age tech companies that eventually shut down
🚩 The Borrowing Cycle: When a company constantly needs new loans to pay old ones
Real Example: IL&FS needed to keep borrowing more money to pay existing obligations
SIMPLE RULE: If something looks too good to be true in financial statements, it probably is. Companies with consistently positive trends in all three statements are much safer bets.
10. Your Simple 3-Step Process To Analyze Any Company
Even if you’ve never read a financial statement before, this easy process will help you get started:
STEP 1: THE HEALTH CHECK (BALANCE SHEET)
Look for:
✅ More assets than liabilities
✅ Reasonable debt compared to equity (ideally less than 1:1)
✅ Enough cash to cover at least 6 months of operations
Quick Health Score:
Give 1 point for each criterion met 3 points = Excellent financial health
0-1 points = Potential financial trouble
STEP 2: THE PROFIT CHECK (P&L STATEMENT)
Look for:
✅ Growing sales (year-over-year increase)
✅ Consistent or improving profit margins
✅ Profits growing as fast as or faster than sales
Quick Profit Score:
Give 1 point for each criterion met 3 points = Strong business model
0-1 points = Business may be struggling
STEP 3: THE REALITY CHECK (CASH FLOW STATEMENT)
Look for:
✅ Positive operating cash flow
✅ Operating cash flow similar to or higher than reported profits
✅ Decreasing or manageable investment cash outflows
Quick Cash Score:
Give 1 point for each criterion met 3 points = Strong cash generation
0-1 points = Potential cash problems
FINAL ASSESSMENT:
7-9 total points: Consider for investment 4-6 points: Watch and research more
0-3 points: Probably avoid investing
PRACTICAL EXAMPLE:
Let’s score Asian Paints:
Health Check: 3/3 (low debt, strong assets, plenty of cash)
Profit Check: 3/3 (growing sales, improving margins, strong profit growth)
Reality Check: 3/3 (excellent cash generation, cash exceeds reported profits)
Total: 9/9 – Explains why it’s been one of India’s best investments over decades
Want to take your stock research even further? Discover how top investors find winning stocks using free tools and smart filters.
👉 Read: How to Find the Best Stocks to Beat the Market
11. Final Thoughts: Financial Confidence For Everyone
Understanding financial statements isn’t about becoming an accountant—it’s about protecting and growing your hard-earned money.
Remember These Simple Truths:
🔹 Companies with strong numbers in all three statements tend to make better investments
🔹 Red flags in financial statements often appear months or years before stock prices collapse
🔹 You don’t need to understand every detail—focus on the key metrics we’ve covered
🔹 Compare companies to their industry peers, not just to their own past
YOUR NEXT STEPS:
- Choose one company you own or are interested in
- Find its most recent annual report online
- Apply the 3-step process we just learned
- Repeat with another company and compare results
Final Inspiration:
Every successful investor—from Warren Buffett to Rakesh Jhunjhunwala—started as a beginner. The simple habit of checking financial statements before investing has helped countless ordinary people build extraordinary wealth.
You now have the tools to join them.
12. Disclaimer
The information in this blog is for educational purposes only. Stock names and financial data are based on current trends and do not constitute investment advice.
📌 Stock market investments involve risks, and actual performance may vary.
📌 Always consult a certified financial advisor before making investment decisions.
This blog does not provide personalized investment advice. Investors should conduct their own research before investing.
✅ Liked this article? Share it with your friends!
Do you invest in stocks? Let us know your experience in the comments below! 🚀
13. Common Questions Answered In Simple Terms
How much time will it take me to check a company's financials?
With practice, you can do a basic check in 15-20 minutes. Start with one company per week until you build confidence.
Do I need to check every small detail in these statements?
No! Focus on the major trends and warning signs we’ve covered. As you gain experience, you can dive deeper into specific areas that interest you.
How do I know if a company's debt level is too high?
Compare it to similar companies in the same industry. What’s normal for a power company would be alarming for a software company. Generally, debt less than equity is preferred.
Can companies lie in these financial statements?
Listed companies must follow strict accounting rules, but creative accounting does happen. That’s why checking all three statements together is important—it’s much harder to manipulate all three simultaneously.
Which financial website is best for beginners?
Start with Moneycontrol or Screener.in for their user-friendly formats. As you get comfortable, explore company annual reports for deeper insights.
How far back should I look at a company's financials?
For beginners, 3-5 years provides a good perspective. This helps you see trends rather than just a single year that might be unusually good or bad.